Will Gas Prices Go Down After the Midterms? What the Data Says
Gas prices are unlikely to fall much before or soon after the 3 November 2026 midterms: US regular averaged $4.284 a gallon on 19 October, $1.265 above a year earlier, and the EIA forecasts $4.15 for the fourth quarter. The EIA only sees a meaningful drop in 2027, to $3.24 by late 2027, and that depends on oil flows through the Strait of Hormuz recovering, not on the election.
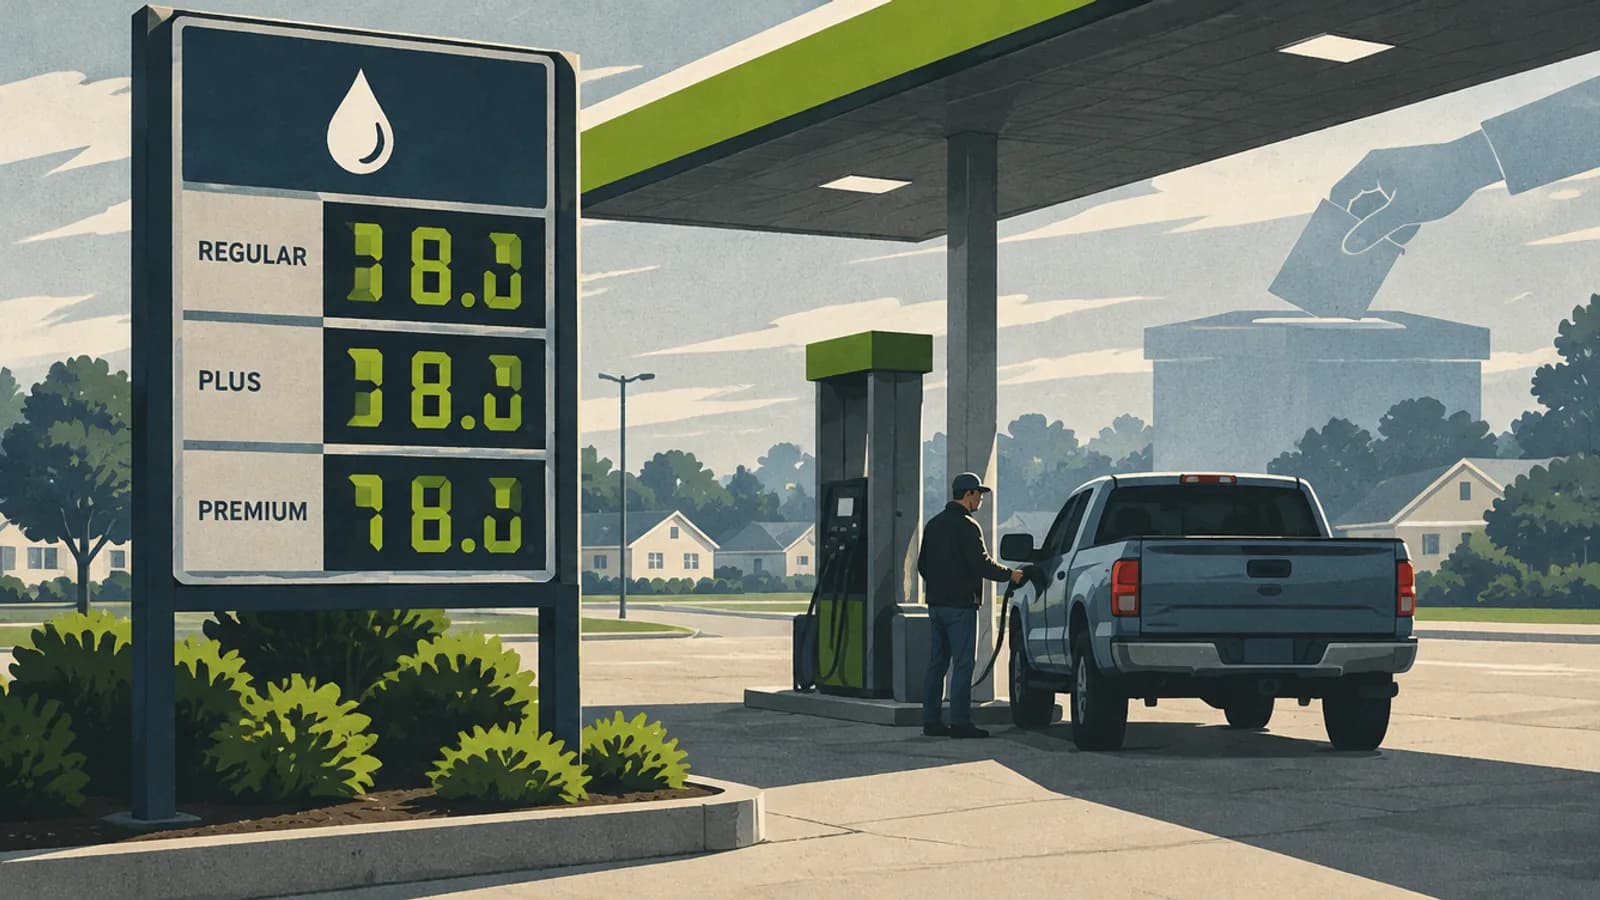
The short answer: prices are easing slowly, and the election is not the reason
Gas prices are drifting down, from $4.354 on 5 October to $4.284 on 19 October, but the EIA expects them to stay above $4 through the end of 2026. The forecast drop comes in 2027 and rests on Middle East oil supply recovering. Nothing in the official data links that timing to election day.
On 9 September 2026, President Trump told reporters that oil prices pushed up by the Iran war likely would not come down until after the midterms, saying "right after the election, oil prices are going to be tumbling downward," while adding it could take "a little bit longer," according to the Associated Press. That set up a simple question for drivers: is there any reason to expect relief right after 3 November?
The data say partly, and slowly. The US Energy Information Administration (EIA) weekly survey shows regular gasoline at $4.284 a gallon in the week of 19 October, down 7 cents in two weeks but $1.265 higher than a year earlier. The EIA’s October Short-Term Energy Outlook, a forecast, puts the fourth-quarter 2026 average at $4.15, then $3.71 in early 2027 and $3.24 by late 2027.
The forecast is built on one big assumption: that oil flows from the Middle East stay constrained through the fourth quarter and then gradually improve. That is a statement about the war and shipping through the Strait of Hormuz, not about the election calendar. If the conflict ends quickly, prices could fall faster; if it escalates, they could rise.
How high are gas prices in 2026 compared with last year?
US regular gasoline averaged $4.355 a gallon in September 2026, 37.6% more than the $3.166 of September 2025, according to EIA monthly data. Prices jumped from $2.908 in February to $4.479 in May after the US-Israel strikes on Iran began on 28 February, eased in summer, then climbed again in September.
US regular gasoline, monthly average, Jan 2025 – Sep 2026 ($/gal)
Source: EIA, US regular all formulations retail gasoline price (monthly)View the data
| Label | Value |
|---|---|
| Jan 25 | $3.08 |
| Feb 25 | $3.12 |
| Mar 25 | $3.10 |
| Apr 25 | $3.17 |
| May 25 | $3.15 |
| Jun 25 | $3.15 |
| Jul 25 | $3.13 |
| Aug 25 | $3.13 |
| Sep 25 | $3.17 |
| Oct 25 | $3.06 |
| Nov 25 | $3.05 |
| Dec 25 | $2.89 |
| Jan 26 | $2.81 |
| Feb 26 | $2.91 |
| Mar 26 | $3.64 |
| Apr 26 | $4.10 |
| May 26 | $4.48 |
| Jun 26 | $4.05 |
| Jul 26 | $3.93 |
| Aug 26 | $4.06 |
| Sep 26 | $4.36 |
By 18 March, AAA’s national average was above $3.84, up about 86 cents from $2.98 before the war and the highest since September 2023, the AP reported. AAA’s national average was $4.2926 on 23 October 2026.
The official inflation figures say the same thing. The Bureau of Labor Statistics reported that the CPI gasoline index rose 34.2% in the 12 months to September 2026, and 9.1% in September alone (seasonally adjusted). Headline inflation was 3.7% and the energy index was up 20.4%. For the wider inflation picture, see our US inflation 3.7% explainer.
Why are gas prices so high in 2026?
Crude oil is the main reason: Brent averaged $114.16 a barrel in September 2026, 68% more than a year earlier, and crude is roughly half of what you pay per gallon. The Iran war has slowed tanker traffic through the Strait of Hormuz, which carried about 20% of the world’s petroleum before the conflict.
According to EIA, crude oil made up 51.4% of the 2025 average retail price of regular gasoline. Refining costs and profits were 14.3%, distribution and marketing 17.8%, and federal and state taxes 16.6%. When crude jumps, the pump price follows within weeks.
| Component | Share, 2016–2025 avg | Share, 2025 |
|---|---|---|
| Crude oil | 51.7% | 51.4% |
| Refining costs and profits | 15.0% | 14.3% |
| Distribution and marketing | 15.9% | 17.8% |
| Federal and state taxes | 17.4% | 16.6% |
Brent crude, monthly average, 2026 ($/barrel)
Source: EIA, Europe Brent spot price FOB (monthly)View the data
| Label | Value |
|---|---|
| Jan | $66.60 |
| Feb | $70.89 |
| Mar | $103.13 |
| Apr | $117.29 |
| May | $107.14 |
| Jun | $85.40 |
| Jul | $83.76 |
| Aug | $91.08 |
| Sep | $114.16 |
Brent pushed past $100 again on 9 September for the first time since July, while US benchmark crude was around $96, the AP reported. Supply cushions have also thinned: Reuters, citing Department of Energy data, reported on 5 October that the Strategic Petroleum Reserve fell to 283 million barrels, the lowest since October 1982, after releases tied to the war.
Refining is a second pressure point. The EIA’s October outlook says gasoline crack spreads, the gap between crude and gasoline prices that roughly tracks refiner margins, will "remain above seasonal averages through the beginning of 2027." Diesel is even tighter: the US on-highway average was $6.276 a gallon on 19 October, and East Coast distillate stocks were 32% below their five-year average in September.
Gas price forecast: what does the EIA expect for late 2026 and 2027?
The EIA forecasts US regular gasoline at $4.15 a gallon in 4Q 2026, $3.71 in 1Q 2027 and $3.24 in 4Q 2027. Its annual averages are $3.91 for 2026 and $3.56 for 2027, against $3.10 in 2025. These are projections, not guarantees, and depend on Middle East supply.
US regular gasoline by quarter: actual and EIA forecast ($/gal)
Source: EIA Short-Term Energy Outlook, October 2026, Table 2View the data
| Label | Value |
|---|---|
| 1Q26 | $3.13 |
| 2Q26 | $4.21 |
| 3Q26 | $4.11 |
| 4Q26 (f) | $4.15 |
| 1Q27 (f) | $3.71 |
| 2Q27 (f) | $3.76 |
| 3Q27 (f) | $3.56 |
| 4Q27 (f) | $3.24 |
| Period | Brent ($/b) | WTI ($/b) | US regular gasoline ($/gal) |
|---|---|---|---|
| 2025 (actual) | 69.04 | 65.40 | 3.10 |
| 4Q 2026 (forecast) | 104.69 | 97.00 | 4.15 |
| 1Q 2027 (forecast) | 94.90 | 90.90 | 3.71 |
| 4Q 2027 (forecast) | 73.94 | 69.94 | 3.24 |
| 2026 full year (forecast) | 96.32 | 88.21 | 3.91 |
| 2027 full year (forecast) | 83.74 | 79.74 | 3.56 |
The EIA says retail gasoline will be "about the same in October as September" and then slowly decrease. It raised its 4Q 2026 Brent forecast by $14 from the previous month, a reminder of how quickly these forecasts move. A year ago, in September 2025, the EIA expected 2026 gasoline to average about $2.90, OPIS reported. Its current 2026 forecast is $3.91, more than $1 higher.
Do gas prices fall before elections?
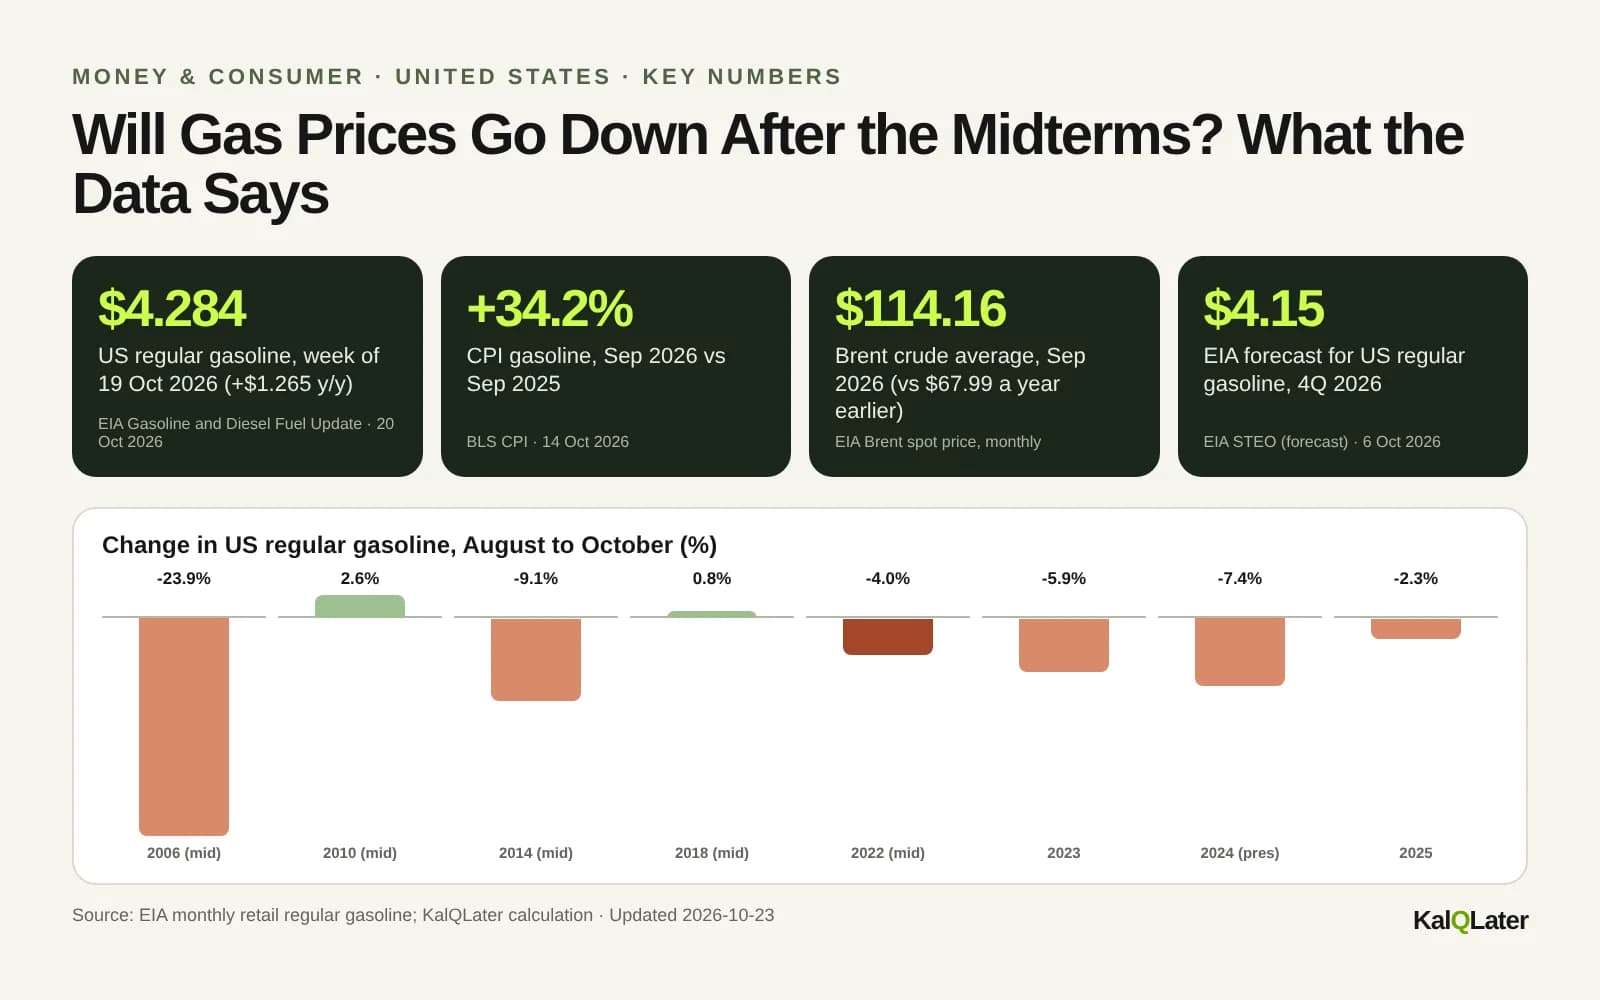
Not reliably: in the last five midterm years, the national average fell between August and October three times and rose twice, according to EIA monthly data. Fall price drops are common in every year because of lower demand and the switch to cheaper winter-blend gasoline, so an autumn dip is mostly seasonal, not political.
Change in US regular gasoline, August to October (%)
Source: EIA monthly retail regular gasoline; KalQLater calculationView the data
| Label | Value |
|---|---|
| 2006 (mid) | -23.9% |
| 2010 (mid) | 2.6% |
| 2014 (mid) | -9.1% |
| 2018 (mid) | 0.8% |
| 2022 (mid) | -4.0% |
| 2023 | -5.9% |
| 2024 (pres) | -7.4% |
| 2025 | -2.3% |
The biggest pre-midterm drop, in 2006, came as crude fell from its summer high; the national average went from $2.952 in August to $2.245 in October. In 2010 and 2018 prices edged up before election day. In 2022, prices had already fallen from a June peak of $4.929 to $3.700 in September, then ticked up to $3.815 in October.
After elections, the pattern is just as mixed. From October to December, prices rose slightly in 2006 (to $2.313) and rose in 2010 ($2.801 to $2.993), fell sharply in 2014 ($3.171 to $2.543, during a global oil glut), fell in 2018 ($2.860 to $2.366) and fell in 2022 ($3.815 to $3.210). Each move lines up with what crude oil did, not with who won.
| Year | August | October | December | Oct to Dec |
|---|---|---|---|---|
| 2006 | 2.952 | 2.245 | 2.313 | +0.068 |
| 2010 | 2.730 | 2.801 | 2.993 | +0.192 |
| 2014 | 3.487 | 3.171 | 2.543 | -0.628 |
| 2018 | 2.836 | 2.860 | 2.366 | -0.494 |
| 2022 | 3.975 | 3.815 | 3.210 | -0.605 |
Why gas prices might fall after the election, and why they might not
Seasonal factors point down: winter-blend gasoline (from 15 September), lower driving demand and a quiet hurricane season. Crude points the other way: the EIA forecasts Brent at $104.69 in 4Q 2026, above the 3Q average. Net, the official forecast is roughly flat pump prices into year end.
- Winter-blend gasoline, which many areas switch to from 15 September, is cheaper to produce (AAA).
- Driving demand usually falls after summer; EIA notes summer demand generally raises prices.
- NOAA’s August update gave a 75% chance of a below-normal Atlantic hurricane season, lowering the risk of Gulf Coast refinery outages. The season runs to 30 November.
- EIA expects Middle East exports to recover gradually as bypass routes and convoys expand.
- EIA forecasts Brent at $104.69 in 4Q 2026, higher than the 3Q average of $95.95.
- Gasoline crack spreads stay above seasonal averages into early 2027 (EIA).
- The SPR is at 283 million barrels, its lowest since 1982, leaving less room for further releases.
- Attacks on tankers and Gulf facilities, reported as recently as September, can move crude quickly.
Local factors matter too. In the week of 19 October, prices fell week on week in most regions but rose in Ohio (+17.9 cents) and Colorado (+9.9 cents), showing how regional refinery and supply issues can override national trends.
Which states have the highest and lowest gas prices?
California is the most expensive state EIA tracks at $6.031 a gallon (19 October 2026), while Texas is the cheapest at $3.704. The West Coast region averages $5.557; the Gulf Coast averages $3.784. Every region is more than $1 above last year.
Regular gasoline by region and state, week of 19 Oct 2026 ($/gal)
Source: EIA Gasoline and Diesel Fuel Update, 20 Oct 2026View the data
| Label | Value |
|---|---|
| California | $6.031 |
| West Coast (PADD 5) | $5.557 |
| Washington | $5.332 |
| Rocky Mountain | $4.468 |
| New York | $4.313 |
| US average | $4.284 |
| Midwest | $4.145 |
| Ohio | $4.049 |
| Florida | $3.981 |
| Lower Atlantic | $3.860 |
| Gulf Coast | $3.784 |
| Texas | $3.704 |
Year on year, the Rocky Mountain region is up the most ($1.471), followed by the West Coast ($1.391) and Midwest ($1.340). California is up $1.605, Colorado $1.518. Washington is up the least of the states shown, at $1.027.
How much more are households paying for gas in 2026?
At today’s $1.265-a-gallon gap to last year, a typical household pays about $97 more a month, or roughly $1,166 a year, for gasoline. Over January to September 2026, the actual extra cost was about $472 per household. A 15-gallon fill-up costs $64.26, up $18.98.
We estimate household gasoline use from EIA data: the US used 136.53 billion gallons of finished motor gasoline in 2025, and light-duty vehicles account for about 91% of it. Dividing 124.2 billion gallons by 134.79 million households (Census, 2025) gives about 922 gallons per household per year. This is an average; a two-car commuter household will use more, and a city household without a car will use none.
| Scenario | Price gap ($/gal) | Extra cost |
|---|---|---|
| One 15-gallon fill-up, 19 Oct 2026 vs year ago | 1.265 | $18.98 ($64.26 vs $45.29) |
| Household, Jan–Sep 2026 vs Jan–Sep 2025 (actual) | 0.683 | ~$472 |
| Household, full year 2026 at EIA forecast ($3.91 vs $3.10) | 0.81 | ~$747 |
| Household, annualised at today’s gap | 1.265 | ~$1,166 (~$97/month) |
| 15-gallon fill-up in California ($6.031) | n/a | $90.47 |
| 15-gallon fill-up in Texas ($3.704) | n/a | $55.56 |
Is there a federal gas tax holiday in 2026?
No. As of 23 October 2026, Congress has not suspended the federal gas tax of 18.4 cents a gallon, despite proposals from both parties. Federal tax is about 4.3% of today’s $4.284 price, so even a full pass-through would cut a typical fill-up by less than $3.
Sen. Mark Kelly (D-Ariz.) floated a suspension in March, Axios reported. In May, President Trump endorsed pausing the tax and Sen. Josh Hawley (R-Mo.) introduced a 90-day suspension of the federal gasoline and diesel taxes, E&E News reported. Some key Republicans opposed cutting Highway Trust Fund revenue. Congress has never approved a federal gas tax suspension.
The Bipartisan Policy Center estimated a five-month suspension would cost $17 billion in revenue, and that most but not all of the cut would reach drivers, per Axios. Georgia and Indiana temporarily suspended some state fuel taxes. On a 15-gallon tank, 18.4 cents equals $2.76.
What should drivers do while gas prices stay high?
Plan for prices near $4 a gallon through the end of 2026, which is what the EIA forecasts, rather than counting on a post-election drop. The biggest savings come from shopping around (regional gaps exceed $2 a gallon), driving less, and budgeting with the EIA’s forecast rather than headlines.
- 1Budget at about $4.15 a gallon for the rest of 2026
That is the EIA’s 4Q forecast. If prices come in lower, the difference is a bonus, not a hole in your budget.
- 2Compare stations, not just brands
Prices vary widely even inside one state. A 20-cent gap on a 15-gallon tank saves $3 per fill-up.
- 3Use regular unless your manual requires premium
EIA’s price surveys track regular; premium usually costs more per gallon with no benefit for cars designed for regular.
- 4Cut wasted miles
Combine errands, check tyre pressure and remove roof racks when not in use. Fewer gallons beat chasing the cheapest price.
- 5Watch the 10 November EIA outlook
The next Short-Term Energy Outlook lands a week after the election and will update the forecast with October data.
- 6Book holiday travel with fuel costs in mind
Jet fuel has pushed fares up too; see our Thanksgiving flights 2026 analysis to compare driving and flying.
Does the president control gas prices?
Only at the margins. Crude oil, priced on world markets, was 51.4% of the 2025 pump price, and taxes another 16.6%. Presidents can influence prices through SPR releases, sanctions, diplomacy and waivers, and wars can raise them, but no president sets the price of a gallon.
Policy can matter, as 2026 shows: the war itself sharply slowed oil traffic through the Strait of Hormuz, and the government has drawn down the SPR to cushion supply. But tools like SPR releases are limited in size relative to a global market, and the reserve is now at a 44-year low.
The honest framing is that the timing of any price drop depends mainly on when Middle East oil flows normalise. That is a geopolitical question, and the EIA’s forecast, made by a nonpartisan statistical agency, does not show a step change tied to 3 November.
Gas price claims vs evidence
“Gas prices will drop right after the election.”
EIA forecasts $4.15 for 4Q 2026, near today’s $4.284, and $3.71 in 1Q 2027. Any faster drop would depend on the war ending, not the vote.
Too early“The president controls gas prices.”
Crude oil was 51.4% of the 2025 pump price and is set on world markets. Policy (SPR, sanctions, war) has influence but not control.
Misleading“Gas prices fall before every election.”
In five midterm years since 2006, prices fell August to October three times and rose twice. Non-election years like 2023 and 2025 also fell.
False“Gas is up more than $1 a gallon from last year.”
EIA: $4.284 on 19 Oct 2026, $1.265 above a year earlier. BLS CPI gasoline +34.2% y/y in September.
True“The Iran war is the main reason gas is expensive.”
Brent rose from $70.89 in February to $103.13 in March, the first full month of the war, and averaged $114.16 in September. Refining margins and low inventories add to it.
Partly true“A gas tax holiday would make gas cheap again.”
The federal tax is 18.4 cents, about 4.3% of the current price, and no suspension has passed Congress.
FalseFrequently asked questions
Will gas prices go down after the midterm elections?
Probably only slowly. The EIA forecasts US regular gasoline at $4.15 a gallon in the fourth quarter of 2026 and $3.71 in early 2027, compared with $4.284 on 19 October. A bigger drop depends on oil flows through the Strait of Hormuz recovering, which is tied to the Iran war rather than the 3 November election.
Why are gas prices so high in 2026?
Mainly because crude oil surged after the US-Israel war with Iran began on 28 February 2026. Brent averaged $114.16 a barrel in September, up from $67.99 a year earlier, and crude makes up about half the pump price. Tight refining margins and low inventories add to the pressure.
What is the average gas price in the US right now?
EIA’s weekly survey put US regular gasoline at $4.284 a gallon in the week of 19 October 2026, $1.265 higher than a year earlier. AAA’s national average was $4.2926 on 23 October 2026. California was highest at $6.031 and Texas lowest at $3.704 among states EIA tracks.
What is the gas price forecast for 2027?
The EIA’s October 2026 Short-Term Energy Outlook forecasts US regular gasoline at an average of $3.56 a gallon in 2027, falling to $3.24 in the fourth quarter. It forecasts Brent at $84 a barrel for 2027. These are projections that assume Middle East supply gradually recovers.
Do gas prices usually drop before elections?
Not reliably. In the five midterm years from 2006 to 2022, US gasoline fell between August and October three times and rose twice. Prices often fall in autumn in any year because of the switch to winter-blend fuel and lower demand, so pre-election dips are mainly seasonal.
How much more am I paying for gas than last year?
A 15-gallon fill-up costs about $64.26 at the 19 October average, $18.98 more than a year earlier. Using about 922 gallons per household per year, today’s $1.265 gap works out to roughly $97 a month, or $1,166 a year, for a typical household.
Is there a gas tax holiday in 2026?
Not at the federal level as of 23 October 2026. Proposals from Democrats and Republicans, including a 90-day suspension bill from Sen. Josh Hawley that President Trump endorsed, have not passed. The federal tax is 18.4 cents a gallon. Georgia and Indiana temporarily suspended some state fuel taxes.
Does winter-blend gas lower prices?
It helps. Many areas switch to winter-blend gasoline from 15 September, and AAA describes it as cheaper to produce. Combined with lower autumn driving demand, that usually pushes prices down in the fall, but in 2026 high crude prices have largely offset the seasonal effect.
How we built this analysis
- Retail prices are EIA’s weekly and monthly US regular all-formulations gasoline averages; the latest weekly figure is for 19 October 2026 (released 20 October). Year-ago values are derived from EIA’s published year-on-year changes ($4.284 − $1.265 = $3.019).
- Forecasts come from the EIA Short-Term Energy Outlook released 6 October 2026 (Table 2) and are labelled as forecasts throughout.
- Household gasoline use: 136.53 billion gallons of finished motor gasoline (EIA, 2025) × 91% light-duty vehicle share (EIA AEO2026) ÷ 134.79 million households (Census via FRED, 2025) = 921.7 gallons per household per year.
- Extra cost: Jan–Sep 2026 average ($3.815) minus Jan–Sep 2025 average ($3.132) = $0.683 × 921.7 × 9/12 = $472; annualised current gap $1.265 × 921.7 = $1,166; full-year forecast ($3.91 − $3.10) × 921.7 = $747; fill-up = 15 × price.
- Election-year comparison: percentage change from EIA August to October monthly averages for 2006, 2010, 2014, 2018 and 2022, with 2023–2025 as non-midterm comparisons. This shows correlation only.
- Federal tax share: 18.4 cents ÷ $4.284 = 4.3%; on a 15-gallon tank, 15 × $0.184 = $2.76.
Limitations
National averages hide wide local differences, and EIA’s weekly survey covers only nine states individually. The household estimate is an average that includes households without cars and some business use of light vehicles, so your own cost depends on how much you drive. EIA forecasts have changed by large amounts during 2026 and could change again with events in the Middle East. Historical election-year comparisons cannot prove cause and effect. This article is for information only and is not financial advice.
Spotted an error? See our corrections policy. Read how we work in our methodology and editorial standards.
Sources
- US Energy Information AdministrationGasoline and Diesel Fuel UpdateWeekly retail prices by region and state, 19 Oct 2026
- US Energy Information AdministrationUS Regular All Formulations Retail Gasoline Prices (monthly)Monthly averages 2006–Sep 2026
- US Energy Information AdministrationEurope Brent Spot Price FOB (monthly)Brent monthly averages 2025–2026
- US Energy Information AdministrationShort-Term Energy Outlook, October 2026Forecasts for Brent, WTI and gasoline (Table 2)
- US Energy Information AdministrationGasoline explained: factors affecting gasoline pricesPrice components and tax rates
- US Energy Information AdministrationGasoline explained: use of gasoline2025 consumption and light-duty share
- US Bureau of Labor StatisticsConsumer Price Index – September 2026Gasoline +34.2% y/y, +9.1% m/m
- US Bureau of Labor StatisticsPrices for gasoline increased 34.2 percent over the year ended September 2026The Economics Daily, 16 Oct 2026
- US Census Bureau via FREDTotal Households (TTLHH)134.79 million households, 2025
- NOAA Climate Prediction Center2026 Atlantic Hurricane Season Outlook update6 Aug 2026; 75% chance below normal
- AAAGas Prices national average$4.2926 on 23 Oct 2026; winter-blend explainer
- Associated Press (via WBTV)
- Associated Press (via The Wenatchee World)
- Reuters (via BOE Report)Oil stocks in US Strategic Petroleum Reserve fall to lowest level since 1982SPR at 283 million barrels, 5 Oct 2026
- Axios / E&E NewsWhat a gas tax holiday would actually do; Trump’s gas tax holiday pitch faces early Capitol Hill headwindsGas tax holiday proposals, May 2026