Will the Fed Raise Rates on October 28? What the Fed Rate Decision for October 2026 Means for Your Mortgage, Credit Card and Savings
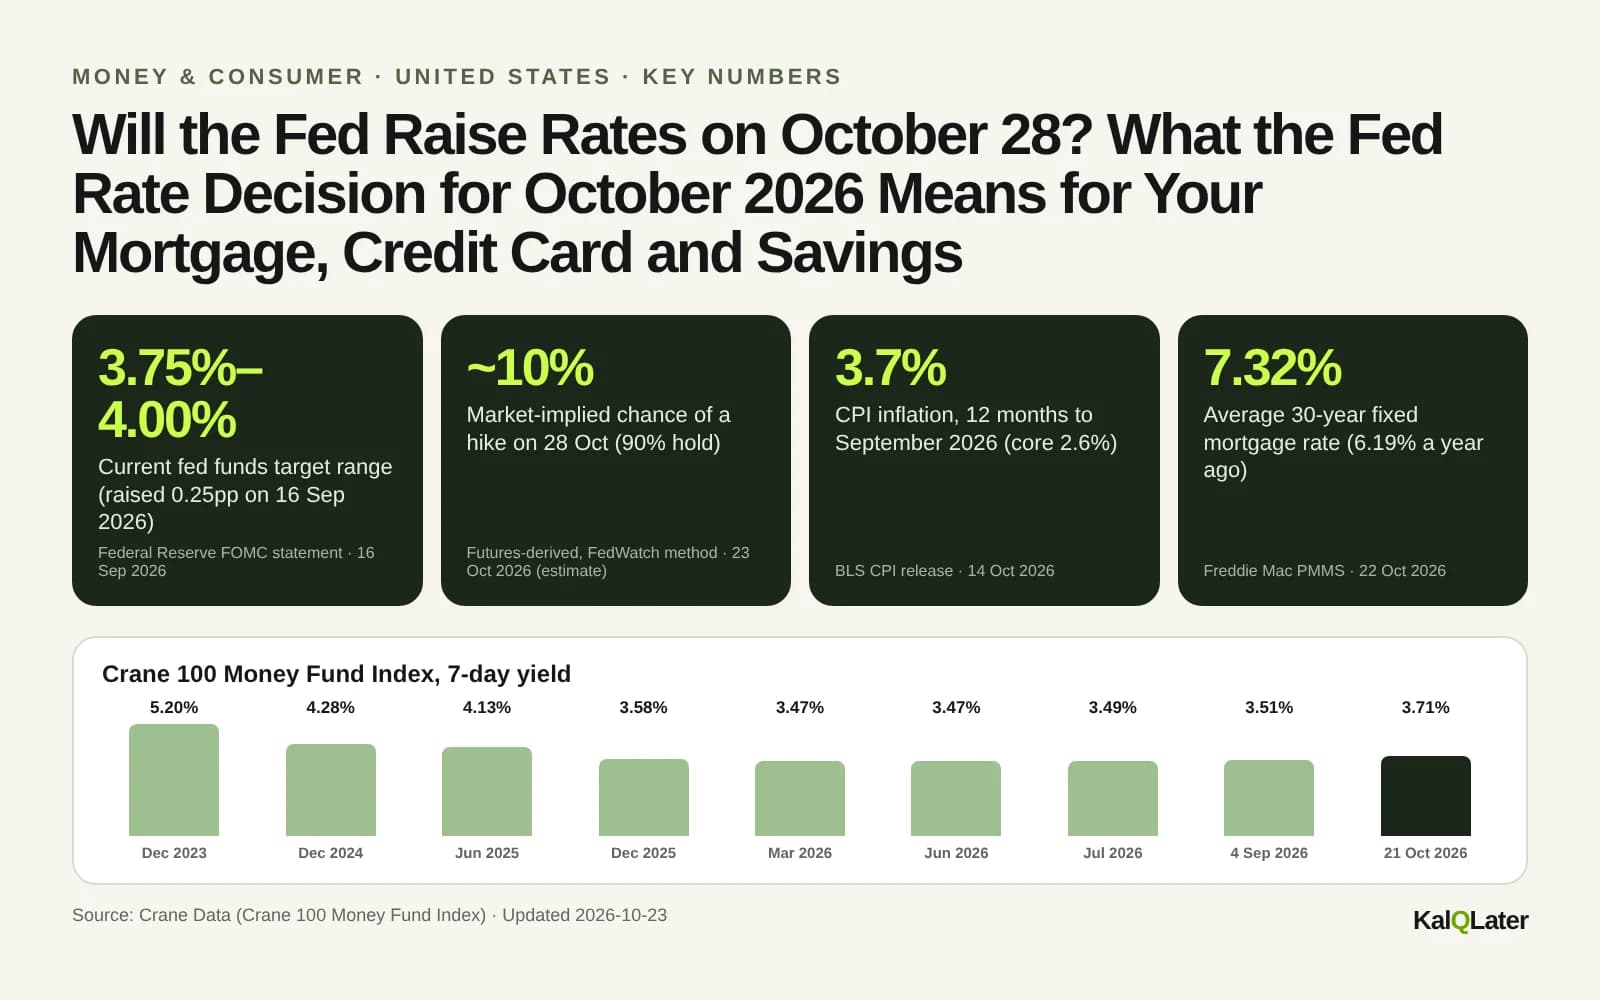
Probably not this time: as of 23 October 2026, futures-derived pricing put the odds of a hold on 28 October at about 90% and a quarter-point hike at about 10%. The Fed raised its target range to 3.75%–4.00% in September and most officials expect one more hike by year end, so December is the meeting markets are watching. A quarter point would add about $68 a month to a new $400,000 30-year mortgage.

Will the Fed raise rates on October 28, 2026?
A hold is the most likely outcome, but a hike is not off the table. Futures-derived pricing on 23 October 2026 implied roughly a 90% chance the Fed keeps its range at 3.75%–4.00%. Most officials have signalled one more increase by year end, and markets lean towards December for that move.
The Federal Open Market Committee (FOMC) meets on 27–28 October 2026, and its statement is due at 2 p.m. Eastern Time on Wednesday 28 October. This article was written on 23 October, before the decision. We do not know the outcome, and nobody else does either.
What we do know: in September the Fed raised rates for the first time since 2023, by 0.25 percentage points to 3.75%–4.00%, in a 12–0 vote. Its September projections show 16 of 18 officials pencilling in at least one more hike before the end of 2026. Headline CPI inflation then rose to 3.7% in September, driven by a 34.2% jump in gasoline prices over the year.
Markets briefly priced close to even odds of an October hike on the morning the CPI came out, then retreated as officials, including New York Fed President John Williams, suggested any further increase could wait until December. Chair Kevin Warsh has repeated that he does not “prejudge meetings”.
Rate change payment calculator: what a Fed move does to your loan
Enter your balance, your current rate and how many years are left, then pick a rate change. Choose fixed amortising (mortgage, auto loan) or variable interest-only (credit card, HELOC draw period) to see your new monthly payment, the yearly difference and the total extra interest over the term. Defaults use the 22 October 2026 Freddie Mac 30-year average of 7.32%.
- Current monthly payment
- $2,747.72
- New monthly payment
- $2,816.06
- Monthly difference
- +$68.33
- Annual difference
- +$820.00
- Total interest difference over the term
- +$24,600.08
Fed moves pass through to prime-based cards and HELOCs, but not automatically to fixed mortgage rates. Not financial advice.
What is the current fed funds rate, and how did we get here?
The federal funds target range is 3.75%–4.00%, and the effective rate was 3.88% on 21 October 2026. After cutting three times in late 2025, the Fed held through July 2026 and then hiked in September as energy-driven inflation climbed.
Fed funds target range (upper bound), every change 2022–2026
Source: Federal Reserve, Open Market Operations (target range changes)View the data
| Label | Value |
|---|---|
| Jan 2022 | 0.25% |
| Mar 2022 | 0.50% |
| May 2022 | 1.00% |
| Jun 2022 | 1.75% |
| Jul 2022 | 2.50% |
| Sep 2022 | 3.25% |
| Nov 2022 | 4.00% |
| Dec 2022 | 4.50% |
| Feb 2023 | 4.75% |
| Mar 2023 | 5.00% |
| May 2023 | 5.25% |
| Jul 2023 | 5.50% |
| Sep 2024 | 5.00% |
| Nov 2024 | 4.75% |
| Dec 2024 | 4.50% |
| Sep 2025 | 4.25% |
| Oct 2025 | 4.00% |
| Dec 2025 | 3.75% |
| Sep 2026 | 4.00% |
The 2022–23 hiking cycle took the range to 5.25%–5.50%. Cuts began in September 2024 and resumed in late 2025, bringing the range down to 3.50%–3.75% by December 2025. The Fed then held at five straight meetings from January to July 2026.
| Meeting | Decision | Range after | Vote | Dissents |
|---|---|---|---|---|
| 27–28 Jan | Hold | 3.50%–3.75% | 10–2 | Miran, Waller wanted a 0.25pp cut |
| 17–18 Mar | Hold | 3.50%–3.75% | 10–1 | Miran wanted a 0.25pp cut |
| 28–29 Apr | Hold | 3.50%–3.75% | 8–4 | Miran wanted a cut; Hammack, Kashkari, Logan objected to the easing bias |
| 16–17 Jun | Hold | 3.50%–3.75% | 12–0 | None |
| 28–29 Jul | Hold | 3.50%–3.75% | 9–3 | Hammack, Kashkari, Logan wanted a 0.25pp hike |
| 15–16 Sep | +0.25pp hike | 3.75%–4.00% | 12–0 | None |
| 27–28 Oct | Due 28 Oct, 2 p.m. ET | To be announced | - | - |
The direction of dissent tells the story of 2026. In January and March the minority wanted cuts. By April, three regional presidents were pushing back against signalling cuts, and in July those same three voted for a hike. In September the whole committee joined them. Kevin Warsh took over as Chair in May; April was the last statement under Jerome Powell.
What are the Fed rate hike odds for October 28?
Market pricing points to a hold: about 90% hold and 10% hike on 23 October 2026, based on fed funds futures. Hike odds jumped to around 50% intraday when September CPI came out on 14 October, then fell back to the 15%–18% range for most of the month.
These are market expectations, not forecasts by KalQLater, and they move daily. Here is how the probability of an October hike has shifted, according to reports that quote the CME FedWatch tool and futures-based trackers:
- 9 October (before CPI): about 16%–18% for an October hike and 75%–85% for a hike by year end, per Political.org (source not named).
- 14 October, before the CPI release: about 22% on CME FedWatch, per FinanceFeeds.
- 14 October, 9:21 a.m. ET: about 50% after CPI printed 3.7% (FXStreet, via FinanceFeeds).
- 14 October, 7:23 p.m. ET: 31.6% for October and 89.7% for December on CME FedWatch (FXStreet, via FinanceFeeds).
- Most of October: 15%–18% on CME FedWatch, according to Bloomberg and Reuters coverage summarised by Startup Fortune on 22 October.
- 23 October: about 90% hold and 10% hike, derived from fed funds futures using the FedWatch method; Kalshi and Polymarket prediction markets showed 91.5% hold (PredictionMarketsPicks tracker, 12 p.m. ET).
Why is the Fed even considering a rate hike? Inflation at 3.7%
Because inflation is moving away from the 2% target, not towards it. CPI inflation rose from 3.4% in August to 3.7% in September 2026, the Fed’s preferred PCE gauge was 3.4% in August, and unemployment is low at 4.2%.
The September CPI report showed prices up 0.6% in one month and 3.7% over the year. Energy prices were up 20.4% and gasoline 34.2% from a year earlier. Core CPI, which strips out food and energy, was 2.6%, a tenth above economists’ consensus of 2.5%.
The Fed targets 2% inflation on the PCE price index. That measure was 3.4% in the 12 months to August, and the September figure is not due until 29 October, the day after the decision. The Fed’s own September projections expect PCE inflation to end 2026 at 3.7% before falling to 2.3% in 2027.
Brent crude spot price, 13–20 October 2026 ($ per barrel)
Source: US Energy Information Administration, daily spot prices (released 21 Oct 2026)View the data
| Label | Value |
|---|---|
| 13 Oct | $125.78 |
| 14 Oct | $126.55 |
| 15 Oct | $126.35 |
| 16 Oct | $119.33 |
| 19 Oct | $118.82 |
| 20 Oct | $115.22 |
On jobs, the picture gives the Fed room to tighten. Unemployment was 4.2% in September 2026, close to the 4.1%–4.3% range it has held since May. In the September minutes, almost all officials judged labour-market risks had “diminished and were now broadly balanced”. The next jobs report is due 6 November and the next CPI on 10 November, both after this meeting.
What does the September 2026 Fed dot plot say about more hikes?
The median official expects the fed funds rate to end 2026 at 4.1%, one more quarter-point hike from today. Twelve of 18 officials put their year-end dot at 4.125%, four at 4.375% and only two at today’s 3.875% midpoint.
The Fed publishes a Summary of Economic Projections (the “dot plot”) four times a year. October is not one of those meetings, so the September numbers are the latest.
| Measure | 2026 | 2027 | 2028 | Longer run |
|---|---|---|---|---|
| Fed funds rate (Sep) | 4.1% | 4.1% | 3.9% | 3.2% |
| Fed funds rate (Jun) | 3.8% | 3.6% | 3.4% | 3.1% |
| PCE inflation (Sep) | 3.7% | 2.3% | 2.1% | 2.0% |
| Core PCE inflation (Sep) | 3.4% | 2.5% | 2.2% | n/a |
| Unemployment rate (Sep) | 4.1% | 4.1% | 4.1% | 4.2% |
| Real GDP growth (Sep) | 2.3% | 2.4% | 2.2% | 2.0% |
Between June and September the median path for 2026 rose by 0.3 points and for 2027 by 0.5 points. In other words, the Fed went from expecting cuts next year to expecting rates to stay around 4.1% through 2027. The minutes of the September meeting, published 7 October, said “most participants” judged another increase “would likely be appropriate by year end”, without saying which meeting.
Arguments for a hike, a hold or a cut in October
The case for holding in October is strongest on timing; the case for hiking is strongest on inflation. A cut has almost no support: no official has argued for one since April, and no 2026 dot is below today’s range.
- CPI inflation accelerated to 3.7% in September; core CPI beat forecasts at 2.6%.
- Dallas Fed’s Lorie Logan said in July that “without any policy restraint, inflation will likely continue to trend above target”.
- Minneapolis Fed’s Neel Kashkari warned against repeating the 1970s mistake of waiting too long, preferring “a potential series of small policy moves”.
- Cleveland Fed’s Beth Hammack said price pressures were “broadening rather than fading”.
- September minutes: “many” officials said the longer energy prices stay high, the greater the risk of broader price pressures.
- The September hike was only six weeks ago; its effect has not shown up yet.
- Core CPI at 2.6% is far below headline, suggesting energy is doing most of the damage.
- Brent fell about $10 a barrel between 14 and 20 October.
- New York Fed President John Williams suggested any further increase could wait until December.
- December brings new projections, plus October CPI and jobs data.
- Very weak. Stephen Miran argued for cuts in January, March and April, but none of the 18 September dots for 2026 is below the current 3.875% midpoint.
- A sharp slide in oil prices or a sudden jump in unemployment could revive the argument, but neither had happened as of 23 October.
Chair Warsh has kept his options open. At Jackson Hole on 28 August he said, “We must be confident that underlying inflation is moving to our objective, clearly and at sufficient speed,” and described himself as “committed to a discipline, not to a decision”. In Bangkok on 16 October he said hotter-than-expected inflation had not changed his view and that he does not “prejudge meetings”.
How does a Fed rate hike affect mortgage rates?
Indirectly. A 0.25-point rise on a new $400,000 30-year mortgage at 7.32% adds $68.33 a month, $820 a year and $24,600 over the life of the loan, but only if mortgage rates actually move by that much. Existing fixed-rate mortgages do not change at all.
The Fed sets an overnight rate between banks. Thirty-year mortgage rates follow longer-term bond yields, which react to expected inflation and expected Fed policy over many years. That is why the average 30-year rate is 7.32% today (Freddie Mac, 22 October 2026) versus 6.19% a year ago, even though the Fed’s range was 4.00%–4.25% then and is lower now.
Monthly payment on a new $400,000, 30-year fixed loan at different rates
Source: KalQLater calculation using Freddie Mac PMMS 30-year average (22 Oct 2026)View the data
| Label | Value |
|---|---|
| 6.82% (−0.50) | $2,613.03 |
| 7.07% (−0.25) | $2,680.04 |
| 7.32% (today) | $2,747.72 |
| 7.57% (+0.25) | $2,816.06 |
| 7.82% (+0.50) | $2,885.02 |
Who is exposed to the Fed directly? Borrowers with adjustable-rate mortgages at reset, and anyone shopping for a loan now. If you already have a fixed rate, your payment is locked regardless of what happens on 28 October.
Will a Fed rate hike raise my credit card interest?
Yes, for most card holders, but by less than people think: a 0.25-point rise on a $6,000 balance at 21.19% adds $15 a year, or $1.25 a month. The real cost is the rate itself: that balance already costs about $1,271 a year in interest.
Most card APRs are variable and priced off the prime rate, which banks set 3 points above the top of the Fed’s range. Prime was 7.00% on 21 October 2026. The average card APR across all accounts was 21.19% in August 2026, and 22.36% on accounts that were actually charged interest (Federal Reserve G.19).
| Item | Cut 0.25pp | Hold | Hike 0.25pp |
|---|---|---|---|
| Fed target range | 3.50%–3.75% | 3.75%–4.00% | 4.00%–4.25% |
| Prime rate | 6.75% | 7.00% | 7.25% |
| Interest on $6,000 card balance at avg APR (per year) | $1,256.40 (20.94%) | $1,271.40 (21.19%) | $1,286.40 (21.44%) |
| Interest on $50,000 HELOC at prime + 1 (per year, illustrative) | $3,875 (7.75%) | $4,000 (8.00%) | $4,125 (8.25%) |
| New $400k 30-yr mortgage, if rates moved the same (per month) | $2,680.04 | $2,747.72 | $2,816.06 |
| Interest on $10,000 in a money market fund (per year) | $346 (3.46%) | $371 (3.71%) | $396 (3.96%) |
A home equity line of credit (HELOC) is usually prime plus a margin set by your lender. Using an illustrative margin of 1 point, a $50,000 balance in the interest-only draw period costs $4,000 a year at 8.00%. A quarter-point hike adds $125 a year, about $10.42 a month. Check your own margin in your HELOC agreement.
What does the Fed decision mean for savings and money market yields?
Savers have already gained from the September hike: the Crane 100 money fund index rose from 3.51% in early September to 3.71% on 21 October 2026. A further 0.25-point hike would add about $25 a year per $10,000, but with CPI at 3.7% the real return is close to zero.
Crane 100 Money Fund Index, 7-day yield
Source: Crane Data (Crane 100 Money Fund Index)View the data
| Label | Value |
|---|---|
| Dec 2023 | 5.20% |
| Dec 2024 | 4.28% |
| Jun 2025 | 4.13% |
| Dec 2025 | 3.58% |
| Mar 2026 | 3.47% |
| Jun 2026 | 3.47% |
| Jul 2026 | 3.49% |
| 4 Sep 2026 | 3.51% |
| 21 Oct 2026 | 3.71% |
Money market funds reprice quickly because they hold short-term Treasury bills and repo, which track the fed funds rate. Bank savings accounts tend to move more slowly and by less. A 3.71% yield before tax against 3.7% CPI inflation leaves savers roughly treading water in real terms.
What should borrowers and savers do before October 28?
Do not try to time the Fed; focus on the debts that cost the most. Paying down a 21% card balance is worth far more than any quarter-point move, and locking a mortgage rate is about today’s offers, not the FOMC.
- 1Attack variable, high-rate debt first
At 21.19%, every $1,000 of card debt costs about $212 a year. The Fed decision changes that by $2.50. Paying off the balance or moving it to a 0% transfer offer saves far more.
- 2Check what your HELOC or ARM is tied to
Find the index (usually prime) and the margin in your agreement, then use the calculator above to see the effect of a 0.25-point change.
- 3Shopping for a mortgage? Compare lenders, not meetings
Mortgage rates already price expected Fed moves. A 0.25-point better offer from a second lender saves the same $68 a month on $400,000 as a Fed cut would.
- 4Move idle cash to where the yield is
If cash sits in an account paying far below money market levels (3.71% on the Crane 100 as of 21 October), compare insured high-yield savings accounts, Treasury bills or money market funds.
- 5Watch the 28 October statement and the December meeting
The statement lands at 2 p.m. ET. Look for whether the Fed keeps saying further increases may be needed; that wording matters more for longer-term rates than the October decision itself.
Key dates after the October 2026 Fed meeting
The decision lands on 28 October at 2 p.m. ET, followed by PCE inflation on 29 October, jobs on 6 November, CPI on 10 November and the next FOMC on 8–9 December. December brings new dot-plot projections.
- 28 Oct, 2 p.m. ET: FOMC statement and target range; press conference with Chair Warsh follows.
- 29 Oct: September PCE inflation (BEA), the Fed’s preferred inflation measure.
- 6 Nov: October employment report and next Fed G.19 consumer credit release (card APRs).
- 10 Nov, 8:30 a.m. ET: October CPI (BLS).
- 8–9 Dec: Final FOMC meeting of 2026, with updated economic projections.
We will update this page after the 28 October decision. For the inflation background, see our analysis of US inflation at 3.7%; for Canada’s parallel decision, see the Bank of Canada rate decision.
Claims vs evidence: the October 2026 Fed decision
““The Fed will raise rates again on October 28.””
Futures-derived pricing on 23 Oct implied about 10% odds of a hike and 90% of a hold. Officials signalled another hike by year end without naming the meeting.
Too early““US inflation has hit 3.7%.””
BLS: CPI rose 3.7% in the 12 months to September 2026, up from 3.4%. Core CPI was 2.6% and PCE inflation 3.4% (August).
True““Fed Chair Warsh says inflation isn’t slowing and the 2% target remains the priority.””
At Jackson Hole on 28 Aug he said the Fed must be confident inflation is moving to its objective “clearly and at sufficient speed”; the September statement promised a “timelier return” to 2%.
True““A Fed hike will push mortgage rates up straight away.””
Mortgage rates follow long-term yields. The 30-year average rose from 6.19% to 7.32% over a year in which the Fed’s range fell 0.25 points. Existing fixed loans are unaffected.
Misleading““Fed dissenters are pushing for hikes.””
Hammack, Kashkari and Logan dissented for a hike in July; the whole committee voted 12–0 to hike in September. No dissent has been recorded since.
Partly true““Savers win when the Fed hikes.””
Money fund yields rose to 3.71% (Crane 100, 21 Oct) after September’s hike, but CPI inflation is 3.7%, leaving real returns near zero.
Partly trueFrequently asked questions
When is the Fed rate decision in October 2026?
The FOMC meets on 27–28 October 2026, and the policy statement is due at 2 p.m. Eastern Time on Wednesday 28 October, followed by Chair Kevin Warsh’s press conference. There are no new economic projections at this meeting; the next dot plot comes at the 8–9 December meeting.
Will the Fed raise rates in October 2026?
Markets think it is unlikely but possible. Futures-derived pricing on 23 October 2026 implied about a 90% chance of a hold at 3.75%–4.00% and about 10% for a quarter-point hike. Most officials expect another increase by year end, and markets lean towards December.
What is the current federal funds rate?
The target range is 3.75%–4.00%, set on 16 September 2026 when the Fed raised rates by 0.25 points, its first hike since 2023. The effective federal funds rate was 3.88% on 21 October 2026, and the bank prime rate was 7.00%.
How much does a 0.25% rate hike add to a mortgage payment?
On a new $400,000, 30-year fixed loan at 7.32%, a 0.25-point increase raises principal and interest from $2,747.72 to $2,816.06 a month: $68.33 more, or $820 a year and about $24,600 over 30 years. Existing fixed-rate mortgages are not affected.
How much will a Fed hike raise my credit card interest?
Very little in dollars. A 0.25-point rise on a $6,000 balance adds $15 a year, or $1.25 a month. The bigger cost is the rate itself: at the August 2026 average APR of 21.19%, that balance costs about $1,271 a year in interest.
Why are mortgage rates so high if the Fed only raised once?
Thirty-year mortgage rates follow long-term bond yields, which reflect expected inflation and Fed policy over years. With CPI at 3.7% and the Fed projecting rates near 4.1% through 2027, the Freddie Mac average reached 7.32% on 22 October 2026, up from 6.19% a year earlier.
Is inflation really 3.7%?
Yes, on the headline consumer price index: prices rose 3.7% in the 12 months to September 2026, according to the BLS, driven by a 34.2% rise in gasoline. Core CPI was 2.6%. The Fed’s preferred PCE measure was 3.4% in August; September PCE is due 29 October.
Should I lock my mortgage rate before the Fed meeting?
The Fed meeting itself is a weak reason. Mortgage rates already reflect expected Fed moves and can fall or rise on the day. Compare offers from several lenders and lock when the payment fits your budget. This is general information, not financial advice.
How we built this analysis
- Target range history comes from the Federal Reserve’s Open Market Operations page (effective dates of each change) and the 2026 FOMC statements; votes and dissents are taken from each statement.
- Mortgage payments use the standard amortisation formula M = P × i / (1 − (1 + i)^−n), with P = $400,000, i = annual rate ÷ 12, n = 360. At 7.32%: $2,747.72; at 7.57%: $2,816.06; difference $68.33 a month (unrounded), × 12 = $820.00 a year, × 360 = $24,600.08 over the term. At last year’s 6.19%: $2,447.28.
- Credit card interest is calculated as an annual interest-only cost: $6,000 × 21.19% = $1,271.40; a 0.25-point change = $6,000 × 0.0025 = $15.00 a year ($1.25 a month). APR is the Fed G.19 all-accounts average for August 2026.
- HELOC example assumes prime (7.00%, FRED DPRIME, 21 Oct 2026) plus an illustrative 1-point margin = 8.00% on a $50,000 interest-only balance: $4,000 a year; +0.25pp = $125 a year ($10.42 a month). Money fund example: $10,000 × 3.71% (Crane 100, 21 Oct) = $371; ±0.25pp = ±$25.
- Hike/hold/cut table assumes full, immediate pass-through of a 0.25-point Fed move to prime, card APRs, HELOCs, mortgage rates and money fund yields. This is a simplification to show scale, not a forecast.
- Market probabilities are quoted as reported, with date and source; they come from different venues (CME FedWatch, futures-derived trackers, prediction markets) and should not be averaged.
Limitations
This preview was written on 23 October 2026, before the FOMC decision, and cannot tell you what the Fed will do. Market-implied probabilities are estimates that change by the hour, and some press reports quoting them do not name their source. Our payment examples cover principal and interest only and assume full pass-through of Fed moves, which rarely happens for mortgages and savings accounts. Credit card APR data is from August 2026 and the September PCE figure was not yet published. This page is for information only and is not financial advice.
Spotted an error? See our corrections policy. Read how we work in our methodology and editorial standards.
Sources
- Federal ReserveFOMC statement, 16 September 2026Hike to 3.75%–4.00%, 12–0 vote
- Federal ReserveSummary of Economic Projections, 16 September 2026Dot plot medians and distribution
- Federal ReserveMinutes of the FOMC, 15–16 September 2026Most participants see another increase by year end
- Federal ReserveOpen Market Operations: target range changesRate history 2022–2026
- Federal ReserveFOMC meeting calendars and 2026 statements (Jan, Mar, Apr, Jun, Jul)Meeting dates; links to each statement used for votes and dissents
- U.S. Bureau of Labor StatisticsConsumer Price Index, September 2026CPI 3.7%, core 2.6%, gasoline +34.2%
- U.S. Bureau of Economic AnalysisPCE Price IndexPCE inflation 3.4% (August 2026)
- Freddie MacPrimary Mortgage Market Survey30-year 7.32% (22 Oct 2026), 6.19% a year ago
- Federal ReserveG.19 Consumer Credit, released 7 October 2026Credit card APR 21.19% (all accounts), 22.36% (assessed interest)
- FRED, Federal Reserve Bank of St. LouisEffective Federal Funds Rate; Bank Prime Loan Rate; Unemployment RateEFFR 3.88% and prime 7.00% (21 Oct); unemployment 4.2% (Sep) from series DPRIME and UNRATE
- U.S. Energy Information AdministrationSpot prices for crude oilBrent and WTI daily, 13–20 Oct 2026
- Crane DataCrane 100 Money Fund IndexYield history; 3.71% as of 21 Oct 2026 from cranedata.com
- Fox BusinessFed dissenters warn inflation could become entrenched without monetary policy tightening nowLogan, Kashkari, Hammack statements (31 Jul 2026)
- FinanceFeedsFed rate hike in October? Odds after the 3.7% CPICME FedWatch moves on 14 Oct 2026 (market expectation)
- PredictionMarketsPicksFed rate trackerFutures-derived 90% hold / 10% hike; Kalshi 91.5% hold, 23 Oct 2026 (market expectation)