Gold Price Record High 2026: Is Gold Still Worth Buying?
Gold is not at a record high in October 2026: it closed at $4,132.99 an ounce on 20 October, 26% below the $5,594.82 peak set on 29 January 2026. It is still more than double its 2021 average of $1,799. Over 20 years to end-2025 it narrowly beat the S&P 500 with dividends, but in 2026 it is down about 4% while US prices rose 4%. Whether to buy depends on why you want it.

The short answer: the record was in January, not October
The ‘gold at a record high’ headline is nine months old. Gold peaked at $5,594.82 on 29 January 2026 and was $4,132.99 on 20 October, down 26.1%. Gold remains historically expensive and a useful diversifier, but anyone buying because of a ‘record high’ headline is buying a story that has already reversed.
Several pages circulating this month, including a widely shared ‘Gold surges to record high’ piece attributed to Westpac, describe moves from 2025: Westpac’s note was published in September 2025, when gold first passed $3,600. The real 2026 picture is different. Gold set its all-time high of $5,594.82 on 29 January 2026, then fell 9.5% the next day, on course for its biggest one-day drop since 1983, according to Reuters reporting carried by The Peninsula.
On 20 October 2026, gold closed at $4,132.99 (goldprice.org), and Kitco’s spot bid was $4,123.60 that morning (depor.com). That is about 4.4% below the 2025 year-end close of $4,323 and 4.5% below the price a year earlier (Fortune). Over the same stretch the S&P 500 rose 12.7% this year.
Our verdict: gold has earned its reputation over long periods, and central banks and ETF investors are still buying. But 2026 has been a reminder that gold can fall 20% or more in months, and that it can lose to inflation for years. Treat it as insurance, not a trade on the latest headline. This is not investment advice.
Is gold at a record high right now?
No. Gold’s 2026 quarterly average fell from a record $4,876 in Q1 to $4,268 in Q3. The World Bank’s September 2026 average was $4,319, and the 20 October close of $4,132.99 is the lowest of those reference points.
The World Gold Council (WGC) says the LBMA PM benchmark hit a historical high of $5,405 in January and the Q1 2026 average of $4,873 was a quarterly record. Q2 averaged $4,506, 8% lower. World Bank Pink Sheet data, which use a slightly different daily price, show the slide continued into Q3.
Gold price by quarter, Q3 2025 to Q3 2026 (US$ per troy ounce, average)
Source: World Bank Commodity Price Data (Pink Sheet), October 2026View the data
| Label | Value |
|---|---|
| Q3 2025 | $3,459 |
| Q4 2025 | $4,152 |
| Q1 2026 | $4,876 |
| Q2 2026 | $4,512 |
| Q3 2026 | $4,268 |
Why does the ‘record’ headline keep appearing? Partly because many prices are at records in other currencies or in specific markets, and partly because recycled 2025 headlines are still ranking in search. Gold made 53 new all-time highs on the LBMA PM benchmark during 2025 alone (WGC), so there was no shortage of ‘record’ stories to recycle.
Gold price history: 20 years of annual averages
Gold’s annual average rose from $604 in 2006 to $3,432 in 2025, a 5.7-fold increase. The path was not smooth: after peaking at $1,669 in 2012, the average fell to $1,160 in 2015 and did not regain its 2012 level until 2020.
Gold annual average price, 2006–2025, plus 2026 Jan–Sep (US$ per troy ounce)
Source: LBMA annual averages via MetalCharts (2006–2025); World Bank Pink Sheet quarterly averages (2026)View the data
| Label | Value |
|---|---|
| 2006 | $604 |
| 2007 | $695 |
| 2008 | $872 |
| 2009 | $972 |
| 2010 | $1,225 |
| 2011 | $1,572 |
| 2012 | $1,669 |
| 2013 | $1,411 |
| 2014 | $1,266 |
| 2015 | $1,160 |
| 2016 | $1,251 |
| 2017 | $1,257 |
| 2018 | $1,269 |
| 2019 | $1,393 |
| 2020 | $1,770 |
| 2021 | $1,799 |
| 2022 | $1,800 |
| 2023 | $1,941 |
| 2024 | $2,386 |
| 2025 | $3,432 |
| 2026 Jan–Sep | $4,552 |
Two things stand out. First, the past three years were extraordinary: the annual average rose 23% in 2024 and 44% in 2025. Second, gold had a lost decade in the middle of this chart. Someone who bought at the 2011–2012 average waited roughly eight years just to get back to even in nominal terms, while prices in the shops kept rising.
The 2026 average so far ($4,552) is still above the 2025 average, which is why some data tables show gold ‘up’ this year. Measured from where the year started, it is down.
Has gold beaten the S&P 500 and inflation?
Over 20 years to end-2025, $10,000 in gold grew to about $84,600, versus $79,200 in the S&P 500 with dividends reinvested and $16,500 needed just to keep up with US inflation. Over 10 years the two were close; over five, gold led thanks to its 66% jump in 2025.
We compounded annual returns for gold and for the S&P 500 including dividends from NYU Stern professor Aswath Damodaran’s historical returns dataset, and measured inflation with the US CPI-U index from the Bureau of Labor Statistics (via FRED), December to December.
| Period | Gold total | Gold a year | S&P 500 total (with dividends) | S&P 500 a year | US CPI total | CPI a year |
|---|---|---|---|---|---|---|
| 5 years (2021–2025) | +129.5% | 18.1% | +95.2% | 14.3% | +24.4% | 4.5% |
| 10 years (2016–2025) | +309.4% | 15.1% | +293.6% | 14.7% | +37.0% | 3.2% |
| 20 years (2006–2025) | +745.9% | 11.3% | +692.5% | 10.9% | +64.7% | 2.5% |
| 2026 so far (to 20 Oct) | −4.4% | n/a | +12.7% (price only) | n/a | +4.0% (to Sep) | n/a |
What $10,000 became over 20 years (end-2005 to end-2025)
Source: KalQLater calculation from NYU Stern (Damodaran) annual returns and BLS CPI-U via FREDView the data
| Label | Value |
|---|---|
| Gold | $84,592 |
| S&P 500 (dividends reinvested) | $79,245 |
| Needed to match US inflation | $16,466 |
Why did gold surge, and why has it stalled in 2026?
Central banks and investors bought record amounts while the price climbed, and that demand carried gold through 2025. In 2026 the brake has been rising real interest rates: the US 10-year TIPS yield climbed from 1.82% in February to 2.64% in September as gold’s quarterly average fell 12%.
- Central banks Official buyers added 1,092.4 tonnes in 2024 and 863.3 tonnes in 2025 (WGC). In 2026 the WGC reports 57 tonnes in Q1 (revised down from 244t in a July erratum) and 289 tonnes in Q2. Why they buy, and what it says about the dollar, is covered in our US dollar report.
- ETFs Gold ETFs added 801.2 tonnes in 2025 after a flat 2024. They bought 62t in Q1 2026, sold 45t in Q2, then took in a record $31 billion in Q3 2026, lifting global holdings to a record 4,256 tonnes, per WGC figures cited by Deutsche Börse Commodities.
- Bars and coins Retail bar and coin demand hit 1,374 tonnes in 2025, a 12-year high, and 474 tonnes in Q1 2026, the second-highest quarter on record (WGC).
- Real yields When inflation-protected bonds pay more, holding a metal that pays nothing costs more. The 10-year real yield rose from 1.82% (Feb 2026 average) to 2.64% (Sep) and was 2.76% on 21 October (FRED).
- The dollar WGC attributes Q2 ETF selling to ‘upward adjustments to both inflation and interest rate expectations alongside a strengthening US dollar.’
US 10-year real yield (TIPS), monthly average, 2026 (%)
Source: Federal Reserve Board via FRED, series FII10View the data
| Label | Value |
|---|---|
| Jan | 1.91% |
| Feb | 1.82% |
| Mar | 1.91% |
| Apr | 1.94% |
| May | 2.04% |
| Jun | 2.18% |
| Jul | 2.35% |
| Aug | 2.40% |
| Sep | 2.64% |
Does war push gold up? What the Iran conflict actually did
The US-Israeli war with Iran, which escalated around 1 March 2026, lifted gold only briefly. Gold rose as much as 2.2% toward $5,390 on 2 March, but within two weeks it was falling as oil-driven inflation fears erased hopes of US rate cuts.
MUFG’s 2 March research note records gold climbing toward $5,390 as tanker traffic through the Strait of Hormuz nearly stopped and Brent jumped as much as 13%. By 13 March, the CME FedWatch probability of a rate cut had fallen to 0.9%, and gold had lost more than $50 that week (Hero Bullion).
Oil has stayed high: the World Bank’s Brent average was $116.8 a barrel in September 2026, and Brent futures were $111.47 on 20 October (Yahoo Finance). Higher oil means higher inflation, which keeps interest rates high, which is bad for a non-yielding asset. In 2026, war hurt gold more through rates than it helped it through fear.
Is silver really up 120% this year? The gold/silver ratio explained
No. Silver is down about 23% in 2026, from a first LBMA fix of $74.22 to $57 on 20 October. The ‘silver rises over 120% YTD’ banner seen on dealer sites matches 2025, when silver gained 144.8% on the LBMA benchmark.
Silver had a spectacular 2025 and an even wilder January 2026: the LBMA fix peaked at $118.45 on 29 January, the same day as gold, and spot silver then fell 27.7% in a single session. The 2026 low was $53.80 on 11 June (LBMA fixes via SD Bullion).
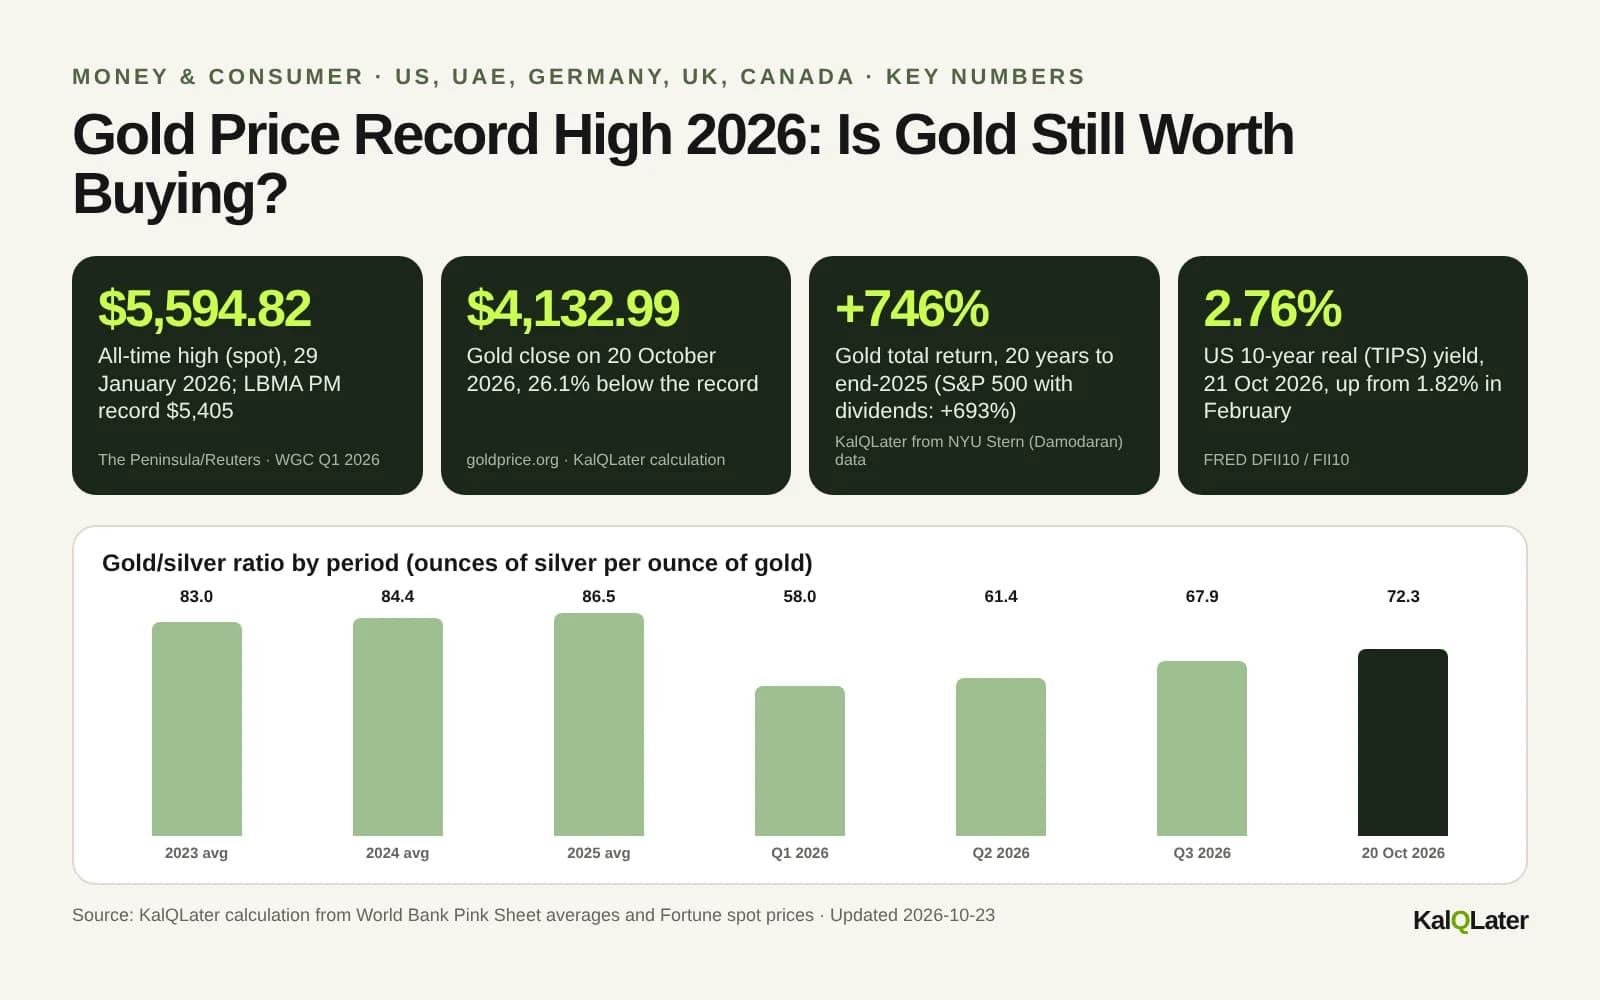
The gold/silver ratio tells you how many ounces of silver buy one ounce of gold. A falling ratio means silver is outperforming. On 20 October, gold at $4,120 and silver at $57 (Fortune, 9 a.m. ET) gave a ratio of about 72, up from 58 in Q1 2026 when silver was strongest.
Gold/silver ratio by period (ounces of silver per ounce of gold)
Source: KalQLater calculation from World Bank Pink Sheet averages and Fortune spot pricesView the data
| Label | Value |
|---|---|
| 2023 avg | 83.0 |
| 2024 avg | 84.4 |
| 2025 avg | 86.5 |
| Q1 2026 | 58.0 |
| Q2 2026 | 61.4 |
| Q3 2026 | 67.9 |
| 20 Oct 2026 | 72.3 |
Silver is part precious metal, part industrial input, so it tends to amplify gold’s moves in both directions. That is why its 2026 fall (−23%) has been about five times gold’s (−4.4%).
How to buy gold: ETFs, coins and bars, jewellery or Xetra-Gold
The cheapest way to hold gold is usually a physically backed ETF or exchange-traded note; the most expensive is jewellery. Coins and bars sit in between, with dealer premiums and storage to consider.
- Trade like shares in a brokerage account
- Annual fee instead of storage costs
- US: physically backed trusts such as GLD are taxed as collectibles
- Global holdings hit a record 4,256 tonnes in September 2026
- You own metal directly; no counterparty
- Dealer premium on purchase and spread on sale
- UK: Sovereigns and Britannias are free of capital gains tax
- Usually VAT-free as investment gold in the UK, EU and UAE
- Making charges added to the gold value
- UAE: 5% VAT on the whole piece, not just labour
- Resale usually at the metal value only
- Best seen as consumption with some metal value
- Each note is a claim on 1 gram of gold, 100% backed
- Custody fee 0.025% a month (about 0.3% a year)
- Right to physical delivery at any time
- Treated like physical gold for tax: tax-free after one year
Dubai gold rate today: what a 22K purchase really costs
Dubai’s 24K rate was AED 481.00 a gram and 22K AED 445.25 on 23 October 2026. Add a typical making charge and 5% VAT and a 10-gram 22K chain costs about 8.5% more than its gold content.
Dubai City of Gold publishes daily jewellery rates: on 23 October 2026 they were AED 481.00 (24K), 445.25 (22K), 427.00 (21K) and 366.00 (18K) per gram. Investment-grade gold of at least 99% purity is zero-rated for VAT; jewellery carries the standard 5%, applied to the whole piece including making charges.
| Item | Calculation | AED |
|---|---|---|
| Gold value | 10 g × AED 445.25 | 4,452.50 |
| Making charge (simple design) | 10 g × AED 15 (mid-point of AED 10–20/g) | 150.00 |
| Subtotal | 4,602.50 | |
| VAT at 5% | 5% × 4,602.50 | 230.13 |
| Total paid | 4,832.63 | |
| Premium over gold content | 4,832.63 ÷ 4,452.50 − 1 | 8.5% |
How is gold taxed in the US, UK, Germany, UAE and Canada?
Tax can matter more than fees. A US investor can pay up to 28% federal tax on long-term gold gains, while a German investor pays nothing after a year and UK buyers of Sovereigns or Britannias pay no capital gains tax at all.
| Country | Gains on gold | Sales tax / VAT on purchase | Source |
|---|---|---|---|
| United States | Held over 1 year: collectibles rate, max 28% (stocks: max 20%). Physically backed ETF trusts are taxed the same way. High earners may also owe net investment income tax. | State sales tax varies | IRS Topic 409; CNBC |
| United Kingdom | Sovereigns and Britannias: no CGT (sterling is not a chargeable asset). Bars and other coins: CGT at 18% or 24% above the £3,000 allowance (2026/27). | Investment gold VAT-free for individuals | TCGA 1992 s21; GOV.UK; Royal Mint |
| Germany | Physical gold and Xetra-Gold: tax-free if held more than 1 year. Within a year: income tax, unless total private sale gains are under €1,000 a year. | Not covered in our sources; ask the dealer | §23 EStG; BFH via Lohnsteuer-kompakt |
| UAE | No income tax on individuals, so no tax on personal gold gains. | Jewellery 5% VAT on whole piece; 99%+ investment gold zero-rated | u.ae; ClearTax UAE; Khaleej Times |
| Canada | 50% of a capital gain is taxable; frequent traders may be taxed on 100% as business income. | Investment bullion of 99.5%+ purity exempt from GST/HST | CRA; CanAm Bullion |
Worked example (US): a $10,000 long-term profit on gold bullion or a gold ETF trust can cost up to $2,800 in federal tax at the 28% collectibles rate, versus $2,000 on the same profit from stocks at the top 20% rate, or $1,500 for most people at 15%. That gap alone can wipe out years of gold’s edge over stocks in the table above.
Should you buy gold now? What to do in 2026
If you want gold as insurance, buy a modest amount in the cheapest, most tax-efficient form for your country, and ignore ‘record high’ headlines. If you want it to make you rich quickly, 2026 has shown how fast that can go wrong.
- 1Decide what gold is for
Diversification and crisis insurance are reasonable reasons. Beating stocks every year is not: gold lost 27.6% in 2013 and is down about 4% in 2026 while the S&P 500 is up 12.7%.
- 2Size it so a 25% fall would not hurt
Gold fell 26% from its January peak to 20 October. Hold only what you could watch drop by a quarter without selling.
- 3Pick the form by country
UK: Sovereigns or Britannias for CGT-free gains. Germany: physical gold or Xetra-Gold held over a year. US: compare ETF fees and remember the 28% collectibles rate. UAE: 24K bars or coins avoid VAT and making charges.
- 4Check the real price you pay
Compare the dealer or jeweller price with the spot or daily rate. In Dubai, ask for the making charge per gram and remember VAT applies to it.
- 5Buy in stages
Spreading purchases over months reduces the risk of buying at a peak, as anyone who bought on 29 January 2026 can confirm.
- 6Do not chase forecasts
Bank targets for end-2026 range from $4,800 to $6,000 an ounce (July 2026 survey). Forecasters missed 2025 by 25%.
Gold price forecasts for 2026: how have they done?
Forecasters were far too low for 2025 and probably too high for late 2026. The analysts’ average forecast for 2025 was $2,735; the actual average was $3,431.54. For end-2026, J.P. Morgan targeted $6,300 in February, 52% above the 20 October close.
The LBMA’s annual survey found 2025’s actual gold average beat the average of all forecasts by 25%, and even the highest forecast ($3,290) was too low. Bank of America’s October 2025 call for $5,000 in 2026 was briefly right: gold passed $5,000 in late January.
Since then, targets have been trimmed. By July 2026, Goldman Sachs had cut its end-2026 target from $5,400 to $4,900 and Bank of America expected $4,800 by Q4, while J.P. Morgan still saw $6,000 by Q4 (InvestingLive). With gold at $4,133 and about ten weeks left in the year, every one of those targets requires a rise of at least 16%.
Gold claims vs evidence
“Gold is at a record high (October 2026)”
The record was $5,594.82 on 29 Jan 2026. On 20 Oct 2026 gold closed at $4,132.99, 26.1% lower. Recent ‘record’ headlines recycle 2025 stories.
False“Silver is up 120% this year”
Silver gained 144.8% in 2025 but is down about 23% in 2026 ($74.22 first LBMA fix to $57 on 20 Oct).
Misleading“Gold always beats inflation”
Over 20 years to 2025 gold returned 746% vs 65% US inflation, but its annual average fell from $1,669 (2012) to $1,160 (2015) and in 2026 it is down 4% while CPI is up 4%.
Partly true“Gold beats the stock market”
Gold edged the S&P 500 with dividends over 5, 10 and 20 years to end-2025, but only because of its 66% 2025 gain. In 2026 the S&P 500 leads by about 17 points.
Partly true“War sends gold higher”
The Iran war lifted gold toward $5,390 on 2 March, but higher oil, inflation and rates then pushed it down. Real yields rose to 2.76%.
Misleading“Gold will hit $6,000 by end-2026”
J.P. Morgan targeted $6,000–$6,300; Goldman cut to $4,900 and BofA to $4,800. A 45% rise from $4,133 in ten weeks would be unprecedented.
Too earlyFrequently asked questions
What is the highest gold price ever?
Spot gold hit an all-time high of $5,594.82 an ounce on 29 January 2026. The official LBMA PM benchmark peaked at $5,405 that month. The next day gold fell 9.5%, on course for its largest one-day drop since 1983. On 20 October 2026 it closed at $4,132.99, 26% below the record.
Is gold a good investment in 2026?
Gold is down about 4.4% in 2026 to 20 October, while the S&P 500 price index is up 12.7% and US inflation was 3.7% in the year to September. Over 20 years to 2025 it beat stocks slightly. It suits investors who want diversification; it is not a reliable short-term gain. This is not investment advice.
Why is gold price going down in 2026?
The main headwind is higher real interest rates: the US 10-year TIPS yield rose from 1.82% in February to 2.64% in September and 2.76% on 21 October. Oil above $110 after the Iran war raised inflation fears and erased rate-cut hopes, and a stronger dollar prompted Q2 ETF selling of 45 tonnes.
What is the Dubai gold rate today?
On 23 October 2026, Dubai City of Gold listed 24K at AED 481.00 a gram, 22K at AED 445.25, 21K at AED 427.00 and 18K at AED 366.00. Jewellery adds making charges and 5% VAT on the whole piece; 99%+ investment gold is zero-rated for VAT.
Is gold tax-free in Germany?
Yes, for individuals who hold physical gold or Xetra-Gold for more than one year: gains are tax-free under §23 of the Income Tax Act. Sold within a year, gains are taxed as income unless your total private sale gains for the year are under €1,000. Germany’s Federal Fiscal Court ruled in 2015 that Xetra-Gold counts as physical gold.
Do you pay capital gains tax on gold sovereigns in the UK?
No. Sovereigns and Britannias are UK legal tender, and sterling currency is excluded from capital gains tax under section 21 of the Taxation of Chargeable Gains Act 1992. Gold bars and foreign coins are taxable at 18% or 24% above the £3,000 annual allowance for 2026/27.
How is gold taxed in the US?
Long-term gains on physical gold and on physically backed gold ETF trusts are taxed as collectibles at up to 28%, compared with a 20% top rate on stocks. Gold held a year or less produces short-term gains, which do not get the long-term rates. High earners may also owe the net investment income tax.
What is the gold to silver ratio right now?
About 72 on 20 October 2026, with gold at $4,120 and silver at $57 an ounce. It averaged 58 in Q1 2026 when silver peaked, and 86.5 across 2025. A rising ratio means silver is falling faster than gold, which is what has happened since January.
How we built this analysis
- Current prices: goldprice.org close of $4,132.99 for 20 October 2026; Fortune 9 a.m. ET prices ($4,120 gold, $57 silver) for the gold/silver ratio; drawdown = 4,132.99 ÷ 5,594.82 − 1 = −26.1%.
- 2026 year-to-date: gold 4,132.99 ÷ 4,323 (2025 last-trading-day close, MetalCharts) − 1 = −4.4%; silver 57 ÷ 74.22 (first 2026 LBMA fix) − 1 = −23.2%; S&P 500 7,712.57 ÷ 6,845.50 − 1 = +12.7% (price only); CPI-U NSA 336.940 (Sep 2026) ÷ 324.054 (Dec 2025) − 1 = +4.0%.
- Total returns: compounded Damodaran annual gold returns and S&P 500 total returns (cumulative index values 146,077.85 end-2005, 294,115.79 end-2015, 592,914.80 end-2020, 1,157,598.95 end-2025). CPI uses December CPI-U NSA values 196.800, 236.525, 260.474 and 324.054. Example: S&P 20-year = 1,157,598.95 ÷ 146,077.85 = 7.925×, so $10,000 → $79,245.
- Annual averages: LBMA averages for 2006–2025 as published by MetalCharts; the 2026 Jan–Sep figure is the simple mean of World Bank quarterly averages (4,876 + 4,512 + 4,268) ÷ 3 = 4,552.
- Gold/silver ratio = gold price ÷ silver price over the same period (e.g., 2025: 3,442 ÷ 39.8 = 86.5).
- Dubai example uses Dubai City of Gold’s 22K rate for 23 October 2026, an assumed making charge of AED 15/g (mid-point of the AED 10–20/g range cited by Angel One for simple designs) and 5% VAT on the full price.
Limitations
Gold returns here exclude storage, insurance, dealer spreads and ETF fees, and S&P 500 returns exclude fund fees; both are before tax. Results depend heavily on start and end dates, and all windows end in 2025, a year in which gold returned 66.2%. Q3 2026 World Gold Council demand data, including central-bank buying, are not yet published, and Q1 2026 central-bank figures were revised after release. Tax summaries are simplified, apply to individuals, and may change. Dubai making charges vary widely by shop and design. This article is for information only and is not financial, investment or tax advice.
Spotted an error? See our corrections policy. Read how we work in our methodology and editorial standards.
Sources
- World Gold CouncilGold Demand Trends Q2 2026Q2 2026 demand, LBMA PM averages, central bank and ETF tonnes
- World Gold CouncilGold Demand Trends Q1 2026Q1 record average, $5,405 LBMA high, central-bank erratum
- World Gold CouncilGold Demand Trends Q4 and Full Year 20252024–2025 central bank, ETF and bar and coin totals; 53 record highs
- World BankCommodity Price Data (Pink Sheet), October 2026Gold, silver and Brent monthly and quarterly averages
- LBMAAnnual Precious Metals Forecast Survey 2025: winners announced2025 averages and forecast accuracy
- Federal Reserve Bank of St. Louis (FRED)10-Year TIPS yield (DFII10, FII10), CPI-U (CPIAUCNS) and S&P 500Real yields, inflation and S&P 500 closes
- S&P Dow Jones IndicesU.S. Equities Market Attributes, December 2025S&P 500 close of 6,845.50 on 31 Dec 2025
- NYU Stern (Aswath Damodaran)Historical Returns on Stocks, Bonds, Bills, Real Estate and GoldAnnual gold and S&P 500 total returns
- MetalChartsGold price history (LBMA annual averages)Annual averages 2006–2025 and 2025 close
- Dubai City of GoldDaily gold rates24K/22K/21K/18K AED rates, 23 Oct 2026
- Internal Revenue ServiceTopic no. 409, Capital gains and losses28% collectibles rate; long-term rates
- GOV.UK / legislation.gov.ukCapital Gains Tax rates; TCGA 1992 section 21Sterling excluded from CGT; 18%/24% rates and £3,000 allowance at gov.uk/capital-gains-tax/rates
- Bundesministerium der JustizEinkommensteuergesetz §23One-year holding period and €1,000 exemption limit
- Deutsche Börse CommoditiesXetra-Gold FAQs and ‘Gold ETFs/ETCs: record inflows despite price pullback’Q3 2026 ETF flows (citing WGC); 1 g per note, 0.025% monthly fee
- The Peninsula (Reuters) and MUFG ResearchGold posts biggest one-day drop in four decades; Middle East Daily, 2 March 2026Record high and crash; Iran war market reaction at mufgresearch.com