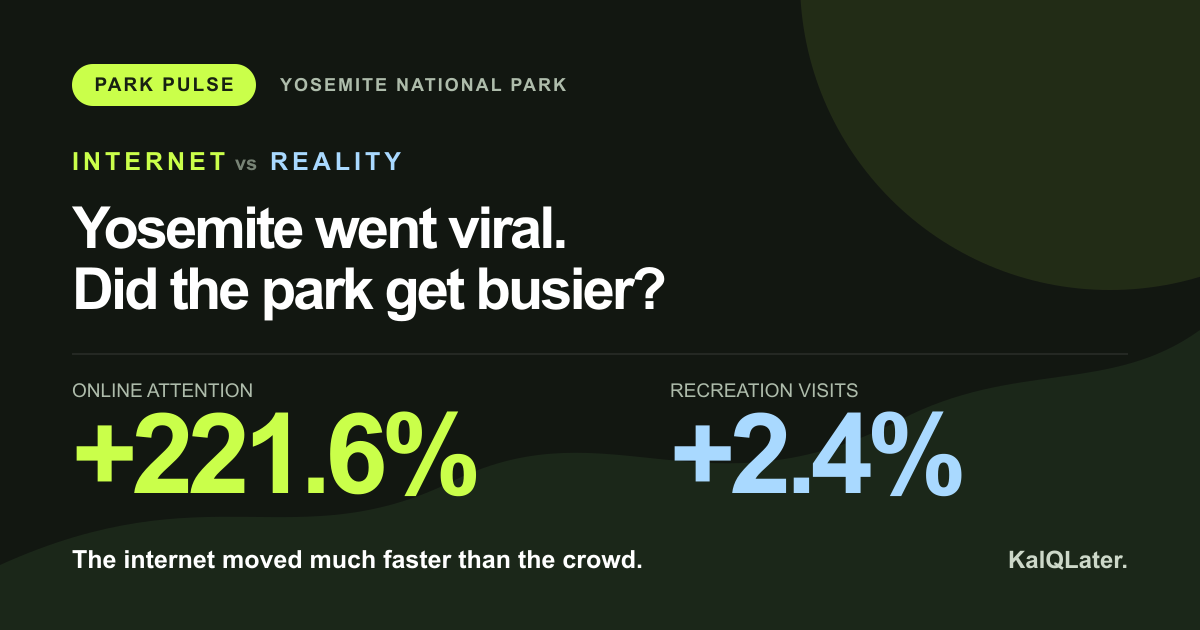
A huge burst of online attention did not produce anything close to the same movement in recorded park visits.
July–September 2025 compared with July–September 2024. These are separate three-month, year-over-year changes.
Each series is indexed to its own typical value for that calendar month. An index of 100 is the baseline; the two raw counts are never treated as the same unit.
| Month | Wikipedia pageviews | Attention index | NPS recreation visits | Visit index |
|---|---|---|---|---|
| Jul 2024 | 38,682 | 81.7 | 574,270 | 99.5 |
| Aug 2024 | 35,095 | 88.9 | 547,217 | 96.0 |
| Sep 2024 | 35,110 | 87.3 | 537,313 | 98.0 |
| Jul 2025 | 190,710 | 403.0 | 616,551 | 106.8 |
| Aug 2025 | 110,268 | 279.3 | 594,060 | 104.2 |
| Sep 2025 | 49,202 | 122.4 | 487,733 | 88.9 |
The attention spike overlaps with the release of Netflix’s Untamed. The timing is notable, but this comparison does not establish that the programme caused the increase.
The Yosemite-set Netflix programme premiered on 17 July, within the same month as the sharp increase in online attention.
Attention reached 403.0 on the seasonal index—about four times its July baseline. Visits were 106.8, or 6.8% above their seasonal baseline.
Pageviews were still 279.3 on the index. The visit index was 104.2.
July–September pageviews totalled 350,180, up 221.6%. Recreation visits totalled 1,698,344, up 2.4%.
Both disclosures contain all 84 validated months. Tables scroll sideways on a small screen.
| Year | Jan | Feb | Mar | Apr | May | Jun | Jul | Aug | Sep | Oct | Nov | Dec | Annual total |
|---|---|---|---|---|---|---|---|---|---|---|---|---|---|
| 2019 | 116,746 | 111,665 | 173,610 | 297,207 | 393,004 | 496,625 | 717,462 | 703,153 | 584,664 | 448,939 | 230,598 | 149,188 | 4,422,861 |
| 2020 | 132,742 | 167,778 | 92,324 | 0 | 0 | 236,534 | 501,068 | 375,226 | 258,561 | 249,827 | 136,799 | 117,454 | 2,268,313 |
| 2021 | 67,284 | 128,222 | 159,906 | 257,158 | 348,006 | 429,980 | 509,874 | 432,038 | 356,030 | 284,611 | 185,213 | 129,273 | 3,287,595 |
| 2022 | 137,057 | 170,196 | 192,634 | 285,601 | 380,905 | 470,045 | 396,833 | 518,407 | 424,374 | 381,612 | 178,786 | 131,100 | 3,667,550 |
| 2023 | 107,256 | 107,012 | 25,005 | 205,802 | 322,308 | 487,618 | 580,357 | 593,378 | 559,464 | 488,566 | 252,249 | 168,055 | 3,897,070 |
| 2024 | 127,789 | 121,027 | 147,102 | 234,232 | 409,748 | 566,111 | 574,270 | 547,217 | 537,313 | 462,467 | 230,748 | 163,783 | 4,121,807 |
| 2025 | 135,684 | 120,601 | 155,758 | 297,621 | 454,491 | 584,333 | 616,551 | 594,060 | 487,733 | 445,779 | 234,709 | 151,093 | 4,278,413 |
| Year | Jan | Feb | Mar | Apr | May | Jun | Jul | Aug | Sep | Oct | Nov | Dec | Annual total |
|---|---|---|---|---|---|---|---|---|---|---|---|---|---|
| 2019 | 59,767 | 54,659 | 73,777 | 55,159 | 57,026 | 55,123 | 61,223 | 53,223 | 52,208 | 50,499 | 43,891 | 39,482 | 656,037 |
| 2020 | 46,084 | 40,713 | 40,316 | 47,071 | 42,223 | 63,418 | 102,930 | 125,202 | 84,167 | 78,305 | 49,854 | 38,152 | 758,435 |
| 2021 | 55,929 | 42,681 | 55,799 | 79,701 | 72,961 | 37,799 | 38,784 | 37,145 | 36,308 | 34,180 | 28,572 | 27,294 | 547,153 |
| 2022 | 33,614 | 33,010 | 34,960 | 36,850 | 40,919 | 37,943 | 54,599 | 38,473 | 43,321 | 40,456 | 33,838 | 29,000 | 456,983 |
| 2023 | 34,904 | 32,798 | 36,286 | 35,607 | 39,815 | 40,253 | 40,047 | 40,474 | 37,101 | 40,132 | 31,068 | 29,115 | 437,600 |
| 2024 | 35,628 | 35,986 | 37,583 | 36,376 | 38,377 | 34,859 | 38,682 | 35,095 | 35,110 | 40,543 | 30,954 | 29,873 | 429,066 |
| 2025 | 47,040 | 39,019 | 42,290 | 29,453 | 33,641 | 31,181 | 190,710 | 110,268 | 49,202 | 47,918 | 32,098 | 29,355 | 682,175 |
The July–September pageview change exceeded almost every three-month observation in the 2022–2024 published calibration.
The visit movement was ordinary relative to Yosemite’s own recent history.
Plain-language reading: Attention growth was unusually extreme. Visit growth wasn’t.
The 2022 calibration observations compare partly with pandemic-disrupted 2021. The percentile is useful context, not a timeless park rating. Park Pulse will require a longer clean calibration before scaling this method.
Retention measures the share of July’s excess over its seasonal baseline that remained after one, two and three months.
110,268 pageviews · seasonal index 279.3
49,202 pageviews · seasonal index 122.4
47,918 pageviews · seasonal index 118.3
retention = (later index − 100) ÷ (peak index − 100)July peak index: 403.0. Above seasonal baseline for 3 consecutive months after the peak.The release date is contextual evidence. Other media, news and public interest could contribute.
A pageview can reflect curiosity, schoolwork, news consumption or repeat requests.
NPS recreation visits count entries. One person can generate more than one visit.
More than 1.70 million recreation visits were recorded in the highlighted three months. The finding concerns the rate of change.
The internet moved much faster than the crowd.
Pageviews and visits remain raw counts in their own tables. Neither is converted into the other.
The headline compares July–September 2025 with July–September 2024, avoiding a summer-versus-winter distortion.
Chart index 100 equals that signal’s calendar-month median across 2019, 2022, 2023 and 2024.
“Attention surged” requires at least +50% growth and the 97.5th percentile. “Visits barely moved” requires an absolute change below 5%.
Exploratory statistical diagnostics are intentionally excluded from the public result. Read KalQLater’s site-wide methodology.
YOSE and the unit label is Yosemite NP.The National Park Service recorded 4,278,413 recreation visits at Yosemite in 2025, up 3.8% from 4,121,807 in 2024. A recreation visit is an entry, not a count of unique people.
July was the busiest month in the 2025 NPS series, with 616,551 recreation visits. August followed with 594,060.
Only slightly in the matched three-month comparison. Wikipedia pageviews rose 221.6% in July–September 2025 from the same months of 2024, while NPS recreation visits rose 2.4%. The datasets do not show whether any individual pageview led to a visit.
The spike overlaps with the July 17, 2025 premiere of the Yosemite-set series Untamed. The timing is notable, but this comparison does not establish that the programme caused the increase.
No. Wikimedia pageviews count requests for the English Wikipedia article after user-agent filtering. They are a measure of article attention, not Google searches, unique people, bookings or intent to visit.
Yes. The downloadable CSV covers every month from 2019-01 through 2025-12 and includes raw pageviews, raw visits, seasonal baselines, indexed values and year-over-year changes.
These are research directions, not live pages or navigation links.
Monthly attention and visitation compared.
Needs more clean history before any public lead claim.
Current lag evidence is exploratory and not publication-ready.